It means steady. Safe. Changeless. Right?
The only #climatechange chart you need to see. https://t.co/XWPo00GulS
— National Review (@NRO) December 14, 2015
(h/t @powerlineUS) pic.twitter.com/QcrN2fCouT
Welp. This chart will stir it up. But here’s the thing: It's not wrong. It’s accurately plotted. Annoying? As one friend put it to me, “That chart may not be wrong, but it’s wrong.”
It’s instructive that this chart infuriates people. It tells us something about how we read charts. How we feel them.
What this chart maker understands is that we don’t actually read data or objectively parse the statistical facts encoded in a chart. We respond to representations, not values. We see a shape. We decide what that shape means. We form a story about it.
In psychology, this is related to the central Gestalt principle called the law of Prägnanz, which means pithiness. We find the easiest meaning we can in the object itself, at a glance.
So, the densely clustered points on a scatter plot become an idea: this is where “normal” is. That dot over by itself is “different,” the outlier. And on the line chart that shoots up and down steeply, we see “activity” or “volatility,” an unsettled thing.
And here we see a flat line and draw on convention to make meaning: Flat lines mean changelessness. Nothing is happening. It’s steady. Safe.
The chart maker here even accentuated the flatness by starting the y-axis at -10 degrees (!) and extending it twice as far as the top range of values. More values on the Y means less distance between each value, effectively flattening the line. It’s a fascinating twist on a hostile debate. Doctrinaires often chide or ridicule people for truncating or cutting out values from a y axis because doing so exaggerates slopes. Here, not truncating the axis is equally problematic.
Since it’s accurately plotted, this chart demands of anyone who thinks that it’s misleading to produce something as accurate but more convincing about why such small changes are significant. Many people did just that. Some went ahead and truncated the y-axis to make the line rise steeply. Others threw science at the problem, changing the measure plotted to “departures from average temperature” as steeply rising bars:
A chart showing the #Earth is getting hotter. #climatechange https://t.co/I99d1AMrsQ pic.twitter.com/PcUknbyKGi
— EGU (@EuroGeosciences) January 4, 2016
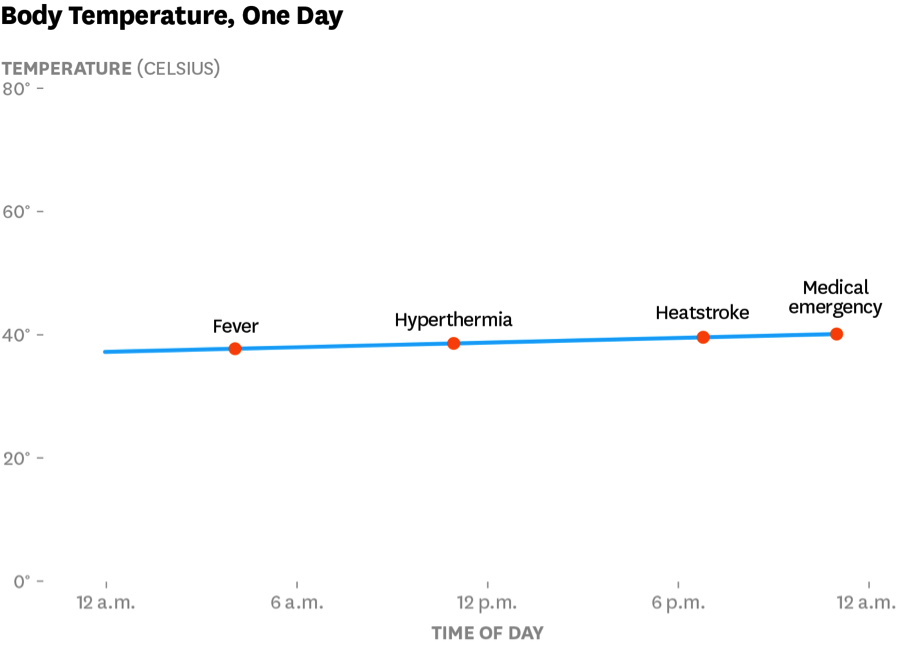
Another approach I like is to attack the Gestalt. Disrupt the expectation about what a flat line means by showing a flat line that nonetheless represents profound change. Here’s one I created using similar techniques as above.

If I ignored this flat line, I’d be dead in a day. Temperature is a funny thing. Sometimes, despite what it looks like, little changes are big deals.