In praise of the unholy mess of a chart

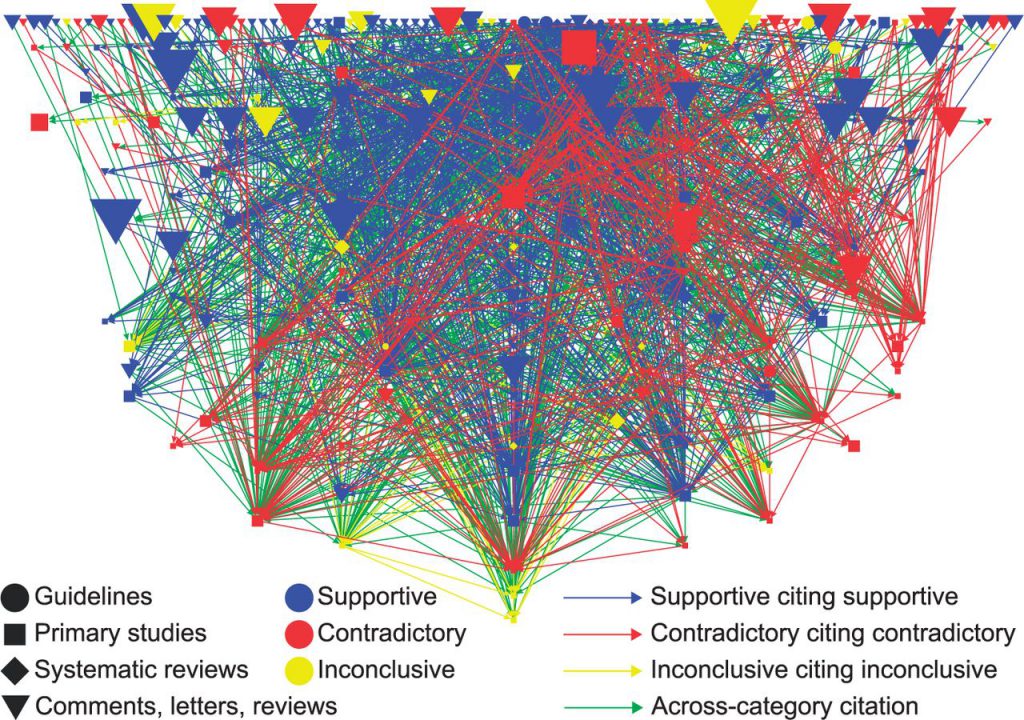
Look at that chart. It’s terrible, right? Primary colors fight for attention. A dense skein of links makes it hard to see connections. Seven variables. Four different shapes of nodes that vary in size. It’s chaos!
All valid design critiques, but let’s not start by focusing on design execution. Start instead with the goal, the idea the author wanted to convey. Ludovic Trinquart and colleagues created the chart for a meta analysis of research papers on salt. The goal was “to try to lay bare and begin to unravel the challenges underlying the dispute” over whether salt is bad for you.
Given that context, I’d argue this rainbow thicket works beautifully. The mess is the thing. So, the colors fight with each other? Yeah, so do conclusions about salt. It’s hard to make sense of how all the research, comments and guidelines connect? Exactly.
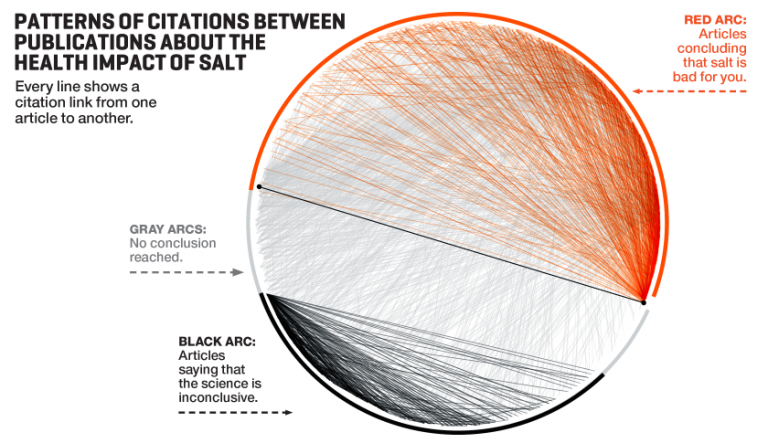
The authors included several clear, orderly charts in the paper as well, so it’s unlikely this one’s chaotic by accident. The data is chaotic! Now, imagine if the chart were honed with sound design principles. Actually, don’t imagine, because a lovely chart on salt research also appeared in Fortune:

I’m still getting that a lot has been written about salt but conflict doesn’t hit me as forcefully here. I don’t feel the underlying confusion; I sense organized, passive disagreement. Even the title uses the word “patterns” which suggests some order. I see some people on one side, more on the other side, and a lot in the background, fading away in that barely-there #e6e6e6 gray, even though “no conclusion reached” may be most important group to highlight.
I like the idea of using chaotic visualizations in three scenarios:
- To convey the singular idea that “things are a mess.” Just don’t expect the chart to do more than establish that one idea.
- To comment on negative complexity. Our inclination is to seek order and make meaning. Messy views can serve as an editorial tool, to assert that something's too messy and needs to be cleaned up.
- To create a storm before the calm. Using chaos to establish the “before” view will heighten the dramatic effect when the clean, calm “after” view is revealed.
Use virtuous chaos sparingly, when it’s the most important idea. Don’t force it. Over-designing chaos into an orderly dataset is a cheap trick. But when it's called for, go ahead and make an unholy mess.